01
Connect your sources
Bring organizational information in from supported data sources.

Turn your organization's people, departments, projects, and relationships into an intelligent knowledge graph. Explore how your company works, discover connections, and make better-informed decisions.
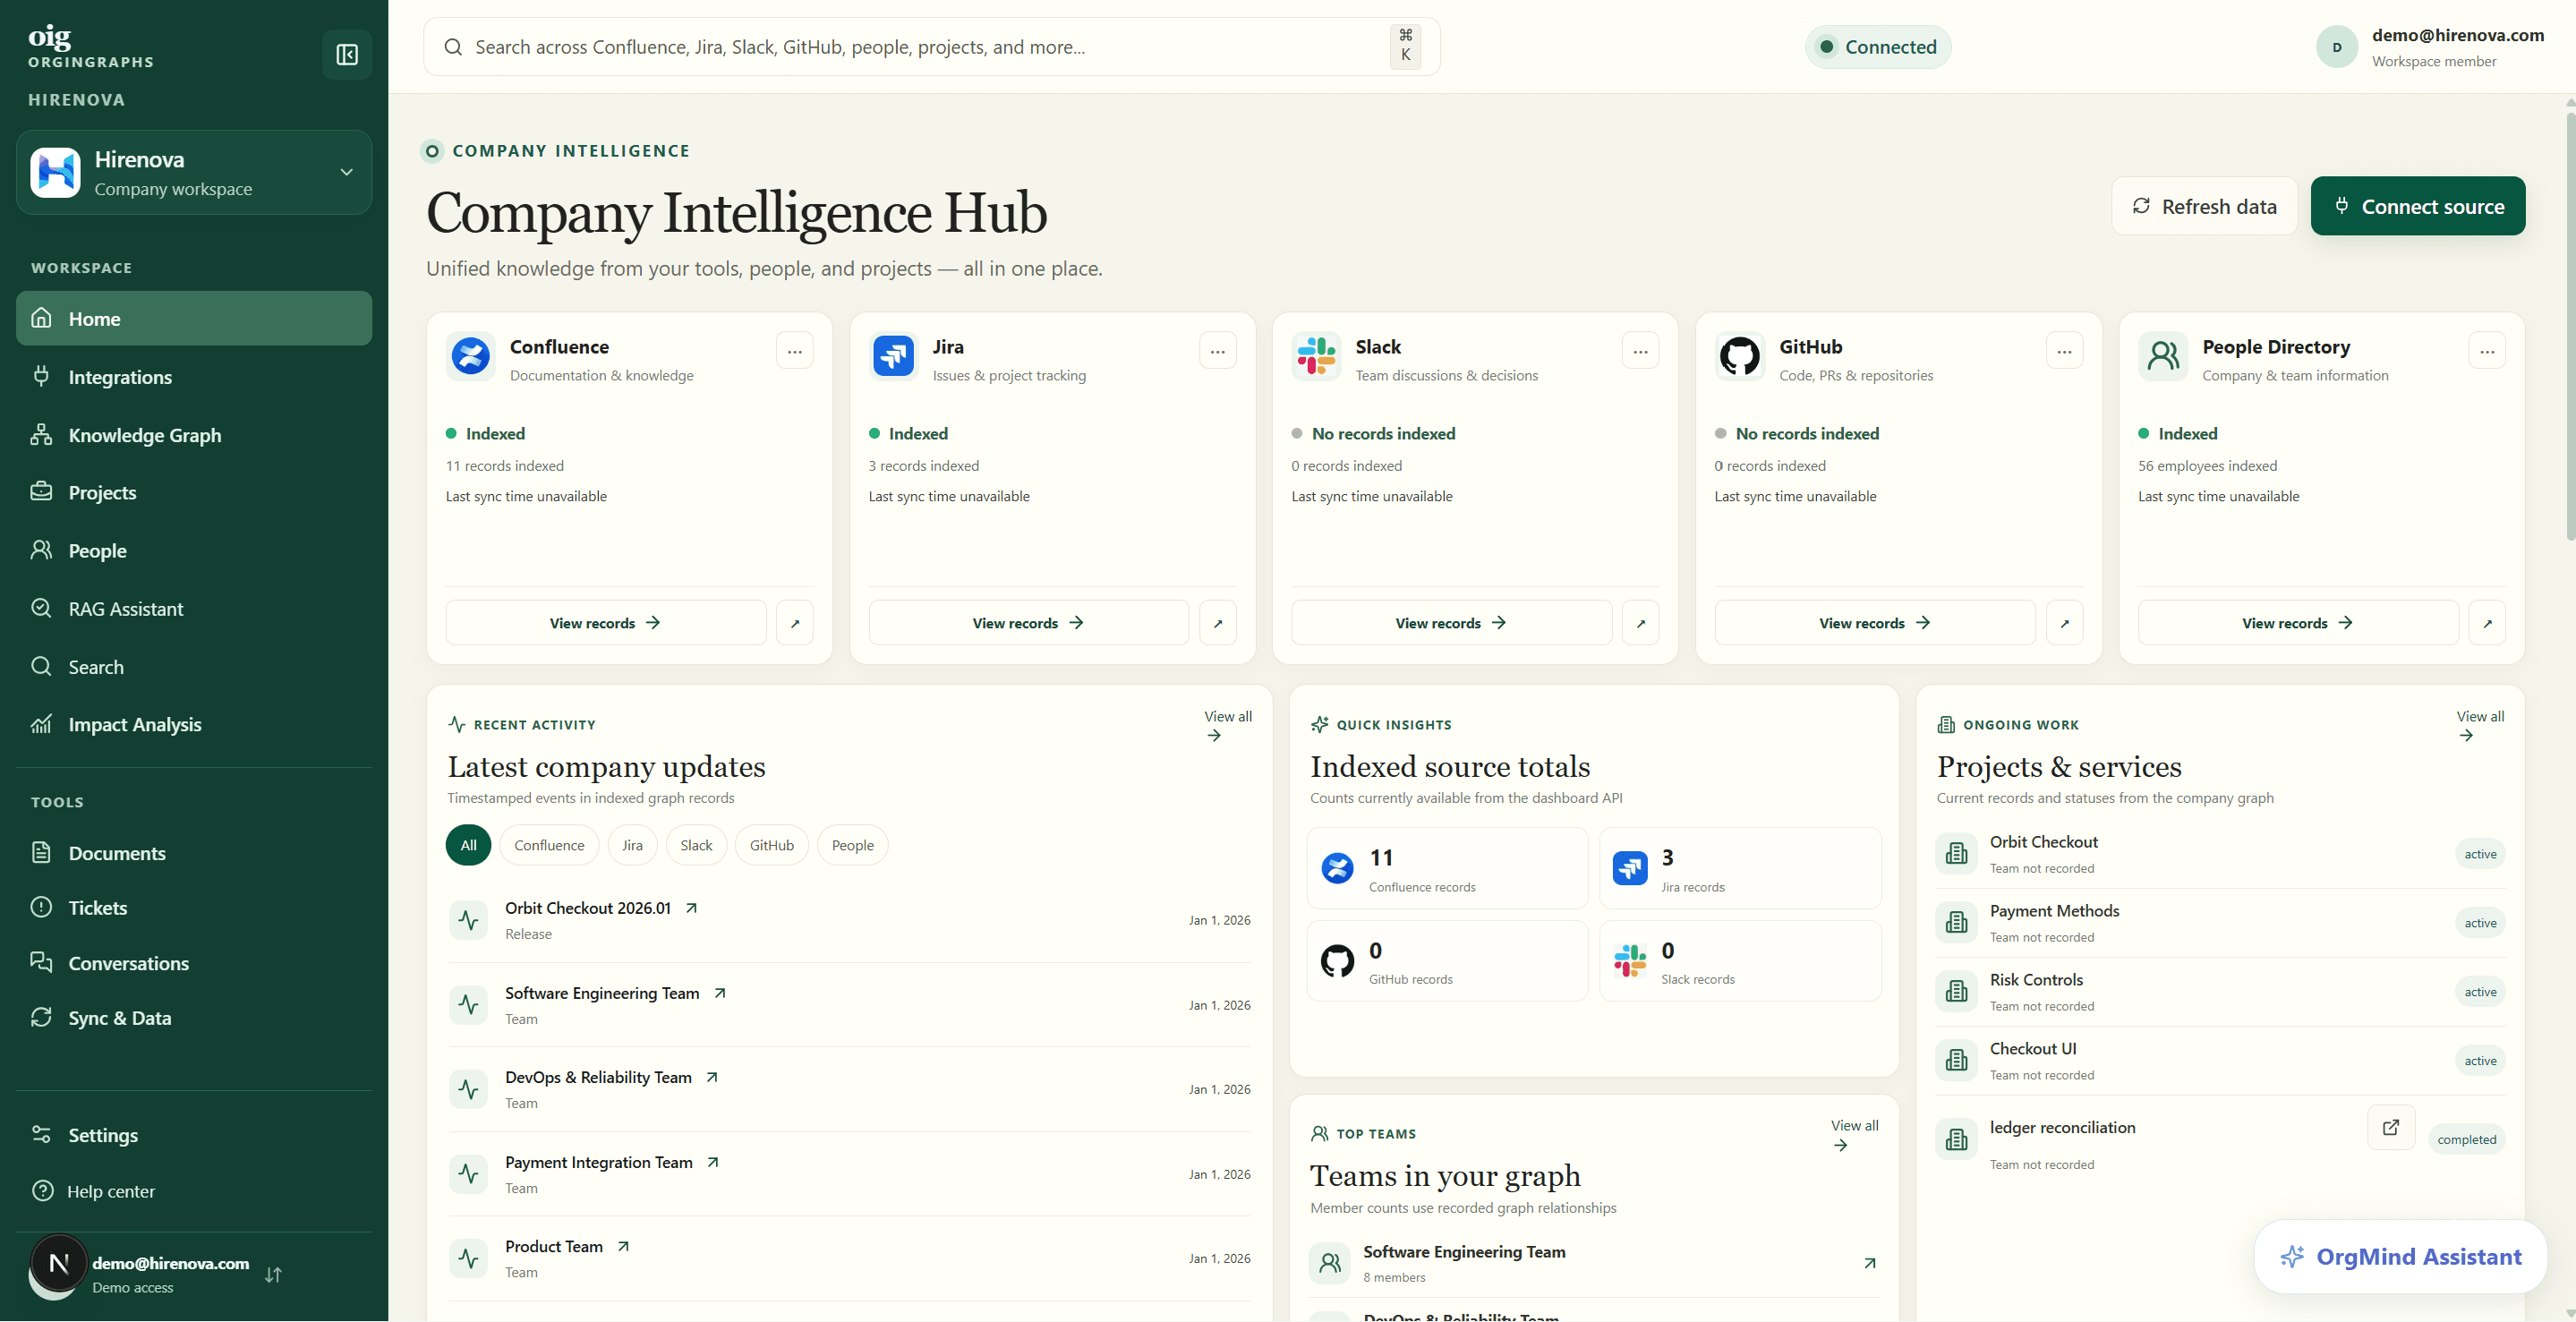
Bring organizational information together, shape the context, and explore how the pieces connect.
Explore the workspaceAlready have a workspace? Sign in
Bring organizational information in from supported data sources.
Normalize and process source documents into structured organizational information.
Explore connected people, teams, projects, and other organizational entities.
Watch the OrgInGraphs walkthrough to explore the product and how connected organizational knowledge can be explored.
Bring organizational context into one connected view, so relationships and dependencies are easier to understand.
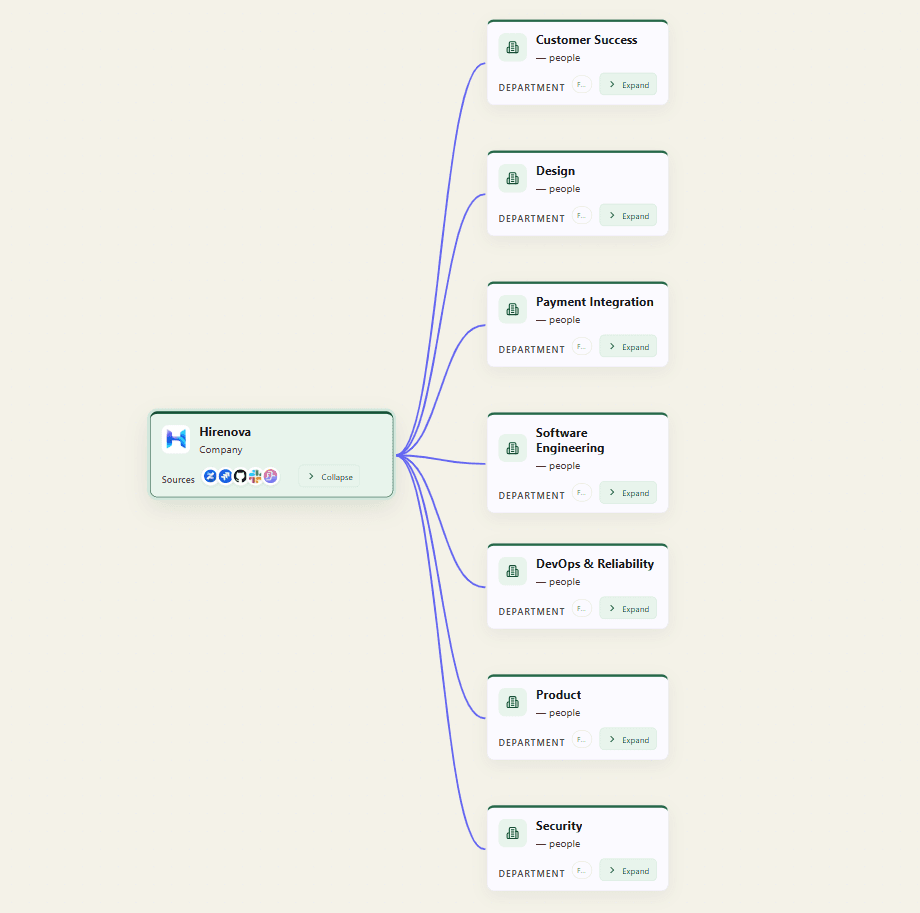
Explore how your company connects to teams, departments, projects, and services.
Source information is processed into searchable context and structured graph relationships. The diagram shows the current product architecture at a conceptual level.
Jira, Confluence, GitHub, and Slack feed Workspace identity ingestion, then the embedding service, then persistent vector storage, and finally the FalkorDB organizational knowledge graph. Amazon Titan Text Embeddings V2 is an alternative 1,024-dimensional configuration.
Illustrative architecture visualization — not a live operational dashboard.
Explore the people, projects, and relationships that make your organization work.